In today’s data-driven world, businesses face abundant information generated from various sources. Extracting valuable insights from this data is crucial for making informed decisions and gaining a competitive edge. Tableau Visualization, a leading data visualization and business intelligence tool, has revolutionized how organizations interpret and communicate data. In this article, we will explore Tableau Visualization in greater depth, including its key features, benefits, and role in revolutionizing data analysis.
Understanding Tableau Visualization
Tableau Visualization is a powerful data visualization and business intelligence platform that enables users to create dynamic and interactive visual representations of data. Designed with a user-friendly drag-and-drop interface, Tableau makes data analysis accessible to technical and non-technical users. With Tableau, users can connect to various data sources, transform data, and create visually stunning dashboards, charts, graphs, and geographical maps. Tableau empowers users to transform raw data into actionable insights through its interactive and visually appealing dashboards.
Key Features of Tableau Visualization
Tableau Visualization is a powerful tool that allows users to create stunning visualizations of their data. It’s an intuitive interface, and robust features make exploring patterns and trends in your data easy. Some critical elements of Tableau Visualization include the ability to create interactive dashboards, drag-and-drop functionality, and support for a wide range of data sources.
- Data Connectivity: Tableau Visualization provides seamless connectivity to various data sources, including spreadsheets, databases, cloud services, and web data connectors. This flexibility allows users to access and analyze data from multiple sources in one unified platform.
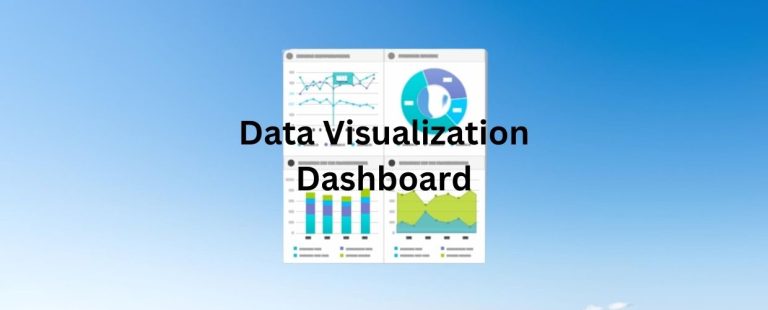
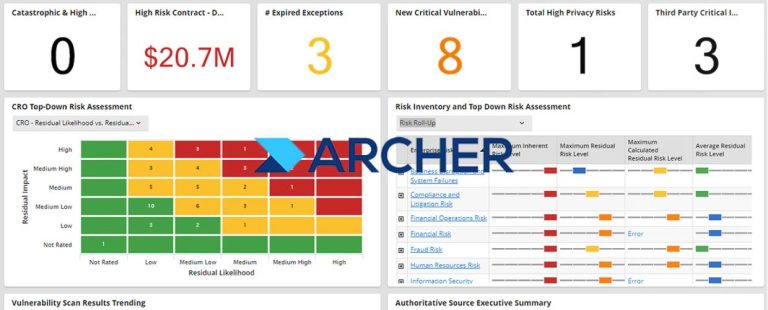
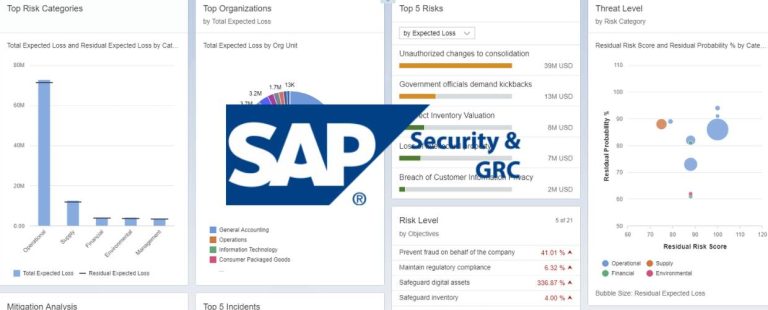
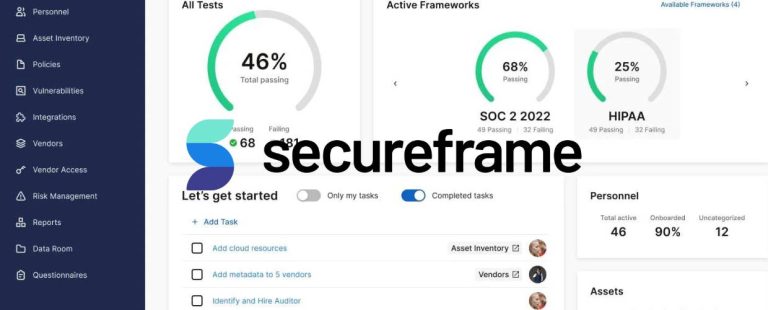
- Interactive Dashboards: One of Tableau’s standout features is its ability to create interactive dashboards. Users can design customized dashboards to present key performance indicators (KPIs) and relevant data metrics. These interactive dashboards empower users to filter, drill down, and explore data dynamically, fostering a deeper understanding of trends and patterns.
- Visualizations and Charts: Tableau offers an extensive library of visualizations and charts to cater to diverse data analysis needs. Users can choose from bar charts, line charts, pie charts, scatter plots, heat maps, and geographical maps. The option to use different visualizations helps users convey information effectively based on the data at hand.
- Data Blending and Joins: With Tableau, users can blend data from various sources and perform to create more comprehensive datasets for analysis. This capability enables organizations to consolidate disparate data sets and gain holistic insights.
- Real-time Analytics: Tableau Visualization supports real-time data analysis, allowing users to monitor live data and receive up-to-date insights. This real-time capability is beneficial for tracking dynamic business metrics and making agile, data-driven decisions.
Benefits of Tableau Visualization
One of the significant benefits of using Tableau Visualization is the ability to identify patterns and trends in your data quickly. Its powerful features and user-friendly interface can help you analyze your data in a previously impossible way.
- Simplified Data Analysis: Tableau Visualization’s user-friendly interface and drag-and-drop functionality make data analysis accessible to a broader audience. Analysts, business users, and executives can quickly create interactive visualizations without extensive technical expertise.
- Faster Decision Making: Tableau accelerates decision-making processes by converting raw data into visually appealing and easy-to-understand visualizations. Users can spot trends, outliers, and correlations at a glance, enabling faster and data-driven decision-making.
- Interactive Exploration: The interactive nature of Tableau dashboards encourages users to explore data freely and interact with visualizations. Users can apply filters, drill down into specific data subsets, and perform ad-hoc analyses, fostering a deeper understanding of the data.
- Better Communication: Tableau Visualization simplifies complex data by presenting it visually engagingly. This approach aids in more transparent communication and data storytelling, making it easier for stakeholders to grasp insights and understand data-driven narratives.
- Data Collaboration: Tableau enables data collaboration within organizations. Users can share interactive dashboards, insights, and reports with team members and stakeholders. This collaborative approach enhances teamwork, knowledge sharing, and decision-making across departments.
Conclusion
Tableau Visualization has emerged as a game-changer in data analysis and business intelligence. Its intuitive interface, interactive dashboards, and diverse visualizations empower organizations to gain valuable insights from their data. By simplifying data analysis, facilitating faster decision-making, and promoting data collaboration, Tableau Visualization unlocks the full potential of data for businesses. Embracing Tableau as a core component of the data analysis strategy allows organizations to adapt to the dynamic and data-centric business landscape. By harnessing the power of Tableau Visualization, businesses can foster innovation, efficiency, and growth, ensuring a competitive advantage in the ever-evolving world of data analytics.
