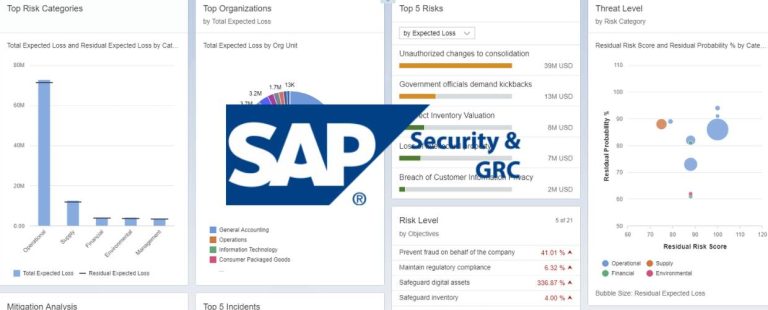
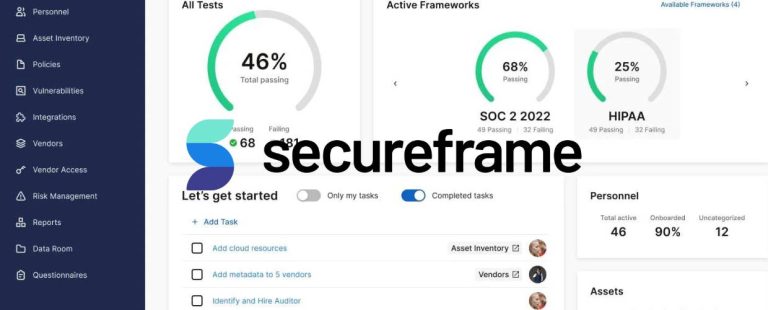
In today’s era of big data, businesses, and organizations are inundated with a constant stream of information. This data’s sheer volume and complexity can be overwhelming, but it also holds immense potential for generating valuable insights. Data visualization dashboards have emerged as an essential solution for navigating this data deluge and extracting actionable information. Serving as centralized platforms, these dashboards offer a visually engaging and user-friendly way to interpret intricate datasets, enabling users to grasp meaningful insights at a glance. This comprehensive article delves deeper into the significance of data visualization dashboards, their key features, and their transformative impact on data-driven decision-making.
The Significance of Data Visualization Dashboards
In the contemporary landscape, data visualization dashboards play a pivotal role in simplifying intricate data complexities, presenting them in a manner that is understandable and insightful. The following points underscore the profound significance of data visualization dashboards.
- Real-Time Insights: Traditional data analysis often involves dealing with stagnant data. Data visualization dashboards shatter this constraint by offering real-time access to data, enabling users to monitor critical metrics and KPIs at any given moment. It empowers agile decision-making, allowing organizations to respond promptly to dynamic situations.
- Data Synthesis: Modern businesses rely on data from various sources, creating a challenge in integrating and synthesizing this data. Data visualization dashboards overcome this challenge by amalgamating data from diverse sources into a coherent view. This streamlined presentation of data facilitates comprehensive analysis and deeper insights.
- Improved Decision-Making: Visual representations of data possess an innate ability to convey complex information succinctly. This visual simplicity accelerates decision-making, as stakeholders can rapidly grasp insights from graphs, charts, and maps. Consequently, this aids in steering organizations toward more informed and effective decisions.
- Identifying Trends and Patterns: Patterns and trends are often concealed within extensive datasets. Data visualization dashboards excel in uncovering these hidden insights, enabling users to identify trends, patterns, and outliers that might not be immediately discernible from raw data alone.
- User-Friendly Interface: Only some people possess advanced data analysis skills. Data visualization dashboards, however, cater to users of varying expertise levels by presenting data through intuitive and user-friendly interfaces. This accessibility democratizes data consumption, ensuring insights are accessible to a broader audience.
Key Features of Data Visualization Dashboards
When it comes to data visualization dashboards, there are a few key features that stand out. For one, they need to be easily customizable so that users can tailor the dashboard to their specific needs.
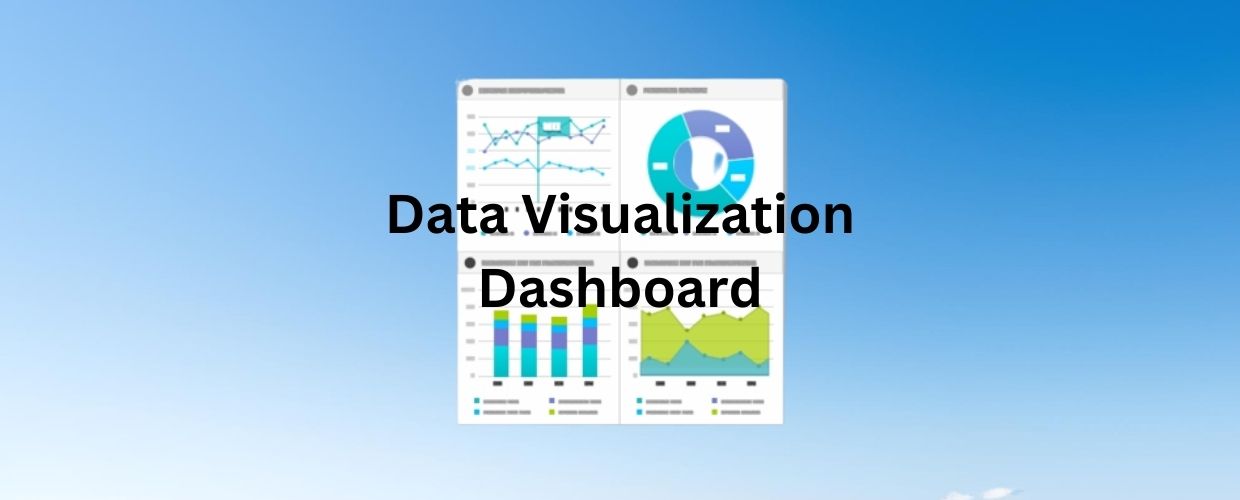
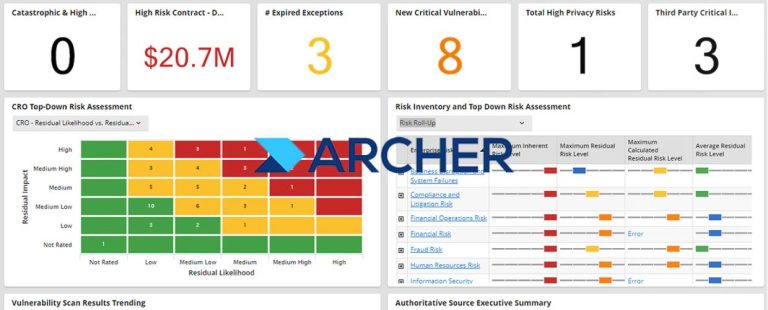
- Interactive Visualizations: Data visualization dashboards offer a dynamic experience by providing interactive charts, graphs, and maps. Users can drill into these visualizations to explore specific data points and uncover profound insights.
- Customizable Widgets: Flexibility is a hallmark of effective dashboards. Users can personalize their dashboard experience by adding, removing, or rearranging widgets. This customization empowers users to focus on the data most relevant to their objectives.
- Real-Time Data Updates: Timeliness is crucial in decision-making. Data visualization dashboards ensure that users constantly work with up-to-date information by automatically updating data in real time.
- Data Integration: Organizations rely on various data sources. It seamlessly integrates data from databases, spreadsheets, and cloud services, delivering a holistic perspective of an organization’s data landscape.
- Data Filters and Segmentation: To extract targeted insights, users can apply filters and segmentation to isolate specific subsets of data. This capability enables focused analysis and empowers users to explore different scenarios.
Transformative Impact of Data Visualization Dashboards
Data visualization dashboards have had a transformative impact on the way we analyze and interpret data. By providing users with customizable, user-friendly interfaces that can handle massive amounts of information, these dashboards have made it easier to extract insights and make data-driven decisions.
- Enhanced Data Accessibility: Data democratization is a cornerstone of modern analytics. Data visualization dashboards make data accessible to organizational stakeholders, breaking down silos and promoting informed collaboration.
- Faster Decision-Making: Quick decisions are imperative in the fast-paced business environment. Real-time, visually compelling insights empower stakeholders to make swift, well-informed choices, providing organizations with a competitive edge.
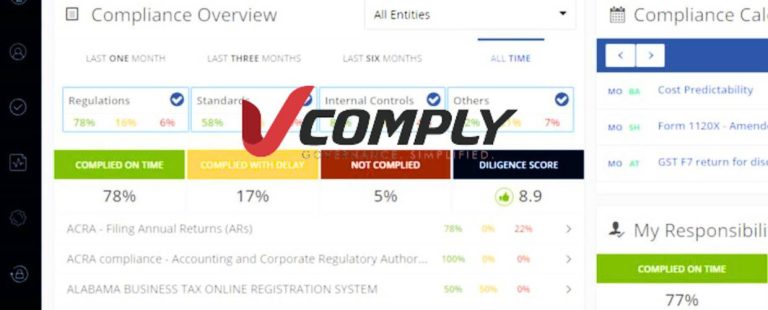
- Improved Performance Monitoring: Monitoring key performance indicators (KPIs) is essential for gauging organizational success. It offers a centralized platform for monitoring KPIs, contributing to heightened operational efficiency.
- Data-Driven Culture: The proliferation of data visualization dashboards nurtures a data-driven culture within organizations. Decisions rooted in data insights hold more weight than those driven solely by intuition, leading to more strategic and impactful choices.
- Identifying Opportunities and Challenges: Visualizations are powerful tools for recognizing growth opportunities and potential challenges. The ability to discern these insights from visual data empowers organizations to stay ahead of the curve.
Conclusion
Data visualization dashboards stand as a testament to the evolving landscape of data utilization. By translating complex datasets into visually engaging and interactive displays, these dashboards empower users to uncover valuable insights swiftly. The amalgamation of real-time data updates, customizable widgets, and seamless data integration cements data visualization dashboards as indispensable assets for businesses striving for data-driven decision-making.
As organizations continue to harness the potential of data, it will persist as a vital instrument, steering decision-makers toward success in an era driven by data and embracing it as a transformational tool that heralds new possibilities, unlocking smarter decisions and more effective solutions in the dynamic realm of modern business.
