In the era of information overload, presenting data in a visually compelling and easily understandable manner is crucial for effective communication. In this article, we will explore the world of Infogram, its key features, and its transformative role in empowering data storytelling through interactive infographics.
What is Infogram?
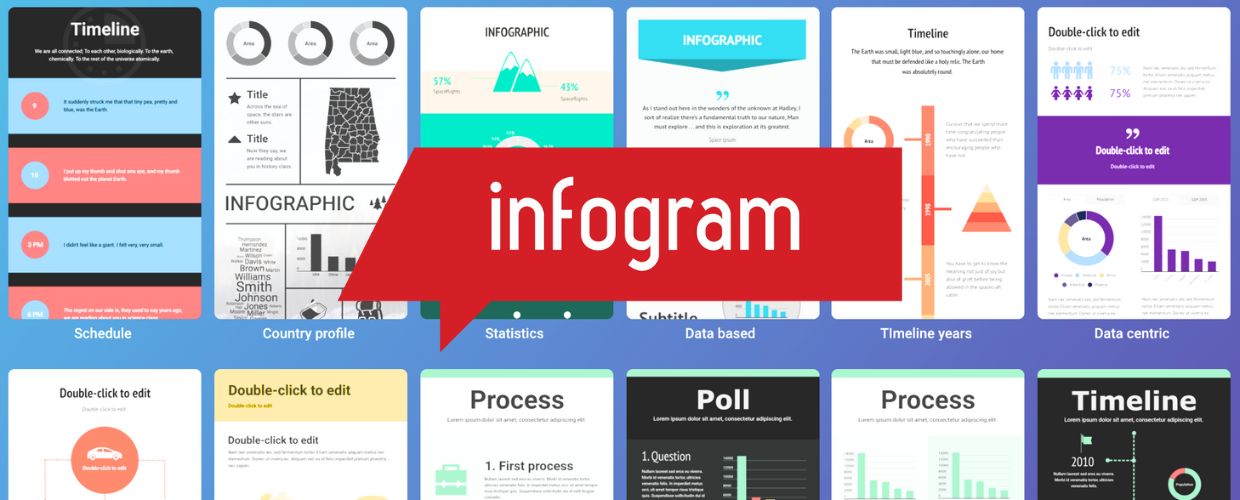
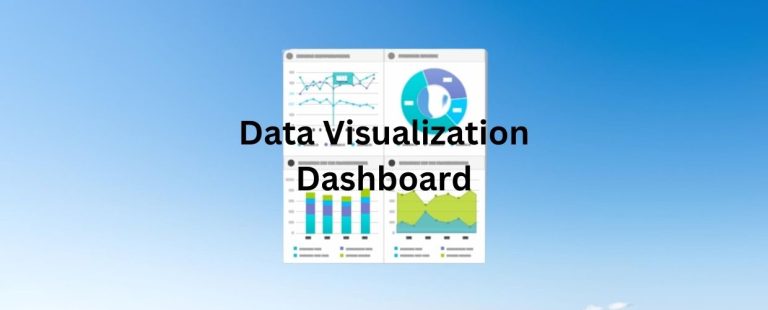
Infogram is a versatile and powerful cloud-based data visualization and infographics platform offering many features and capabilities. Its primary purpose is to enable users, regardless of their technical expertise, to create visually appealing and interactive representations of data, turning complex information into engaging and easy-to-understand visual stories. The platform offers various visual elements, empowering users to present their data dynamically and creatively. Users can choose from multiple charts, including bar charts, pie charts, line graphs, and scatter plots.
With the ability to transform raw data into eye-catching and interactive visual representations, Infogram has become a powerful tool for storytelling and communication. It allows users to present data-driven insights in a compelling and digestible manner, fostering a deeper understanding of the information being conveyed. Moreover, Infogram operates as a cloud-based platform, meaning users can access it from any device with an internet connection. This flexibility enables collaborative efforts among team members located in different places, streamlining the process of creating and sharing data visualizations.
Recommendations and Ratings
EXPERT RECOMMENDATIONS
Overall
-
Easy-of-Use - 95
-
Feature and Functionality - 85
-
Customer Support - 90
-
Setup and Integration - 90
-
Value of Money - 90
User Review
5 (1 vote)Key Features and Capabilities of Infogram
Infogram offers diverse features and capabilities that make it a powerful tool for data storytelling. Some of them are discussed below.
Pre-designed Templates
It provides an extensive collection of pre-designed templates that users can choose from as a starting point for their infographics. These templates cover various industries, topics, and data types, saving time and effort in the infographic creation process. Users can customize these templates with their data, branding, and design preferences.
Interactive Data Visualization
One of its standout features is its ability to create interactive data visualizations. Users can develop engaging charts and graphs that allow viewers to hover over data points for additional insights, click to reveal hidden information, and explore data from different perspectives. Interactivity enhances user engagement and fosters a deeper understanding of the data.
Real-time Data Sync
Infogram lets users connect their infographics to live data sources like spreadsheets or databases. This real-time data sync ensures that the infographics always display up-to-date information. Users can embed live data visualizations on websites, blogs, or presentations, making it ideal for dynamic reporting and live data updates.
Mapping and Geographic Visualizations
The platform supports map visualizations, enabling users to create interactive maps with custom data overlays. Users can plot data points on the map, display regional data, and provide geographical context to their infographics. These interactive maps are handy for presenting location-based insights and trends.
Brand Customization
The visualization solution offers robust branding and customization options. Users can add their company logo, and select custom colors, fonts, and styles, ensuring that the infographics align with their brand identity. Consistent branding across infographics reinforces brand recognition and professionalism.
Collaboration and Sharing
Infogram supports real-time collaboration, enabling multiple users to work on the same infographic simultaneously. Users can invite team members to contribute, review, and edit infographics, promoting collaborative and efficient content creation. Additionally, infographics can be easily shared via social media, email, or embedded in websites for broader audience reach.
Benefits of Infogram
Adopting Infogram offers many benefits for individuals and organizations seeking to communicate data insights effectively. Some of them are given below.
Data Storytelling Simplified
The platform simplifies the process of data storytelling. Its intuitive interface and pre-designed templates allow users to transform complex data into engaging visual narratives without advanced design or coding skills. By presenting data visually compellingly, Infogram helps users effectively convey the meaning behind the numbers.
Engaging and Interactive Content
Its interactive features, such as hover effects, tooltips, and clickable elements, encourage audience engagement and exploration of data. Interactive infographics capture and retain the audience’s attention, leading to better retention of information and a deeper understanding of the insights being presented.
Dynamic and Real-time Reporting
With real-time data sync capabilities, Infogram empowers users to create dynamic reports that automatically updating as new data is added or modified. This feature is precious for live presentations, dynamic dashboards, and reporting on rapidly changing data.
Versatile Use Cases
The data visualization solution caters to various use cases across multiple industries. From business reports and presentations to educational materials, social media visuals, and journalistic infographics, Infogram is a versatile tool for data visualization and storytelling.
Enhanced Data Impact
Its ability to present data in a visually appealing and accessible manner elevates the impact of data-driven content. By simplifying complex data and enhancing its visual representation, Infogram ensures that the message reaches the audience effectively, leading to more informed decision-making.
Time and Cost Efficiency
The platform streamlines the process of creating compelling infographics, saving time and resources that would otherwise be spent on manual design work or hiring specialized designers. Its user-friendly platform enables quick and efficient content creation without compromising on quality.
Conclusion
Infogram is a powerful ally in data storytelling, empowering users to transform raw data into visually captivating and interactive infographics. With its pre-designed templates, real-time data sync, multimedia integration, and collaboration features, the platform simplifies the creation of engaging data visualizations for various use cases. By streamlining data interpretation, enhancing audience engagement, and enabling real-time reporting, the visualization solution helps organizations and individuals communicate complex information effectively. In the age of information, Infogram empowers data storytellers to craft impactful narratives that resonate with audiences, making data-driven insights more accessible and actionable.
