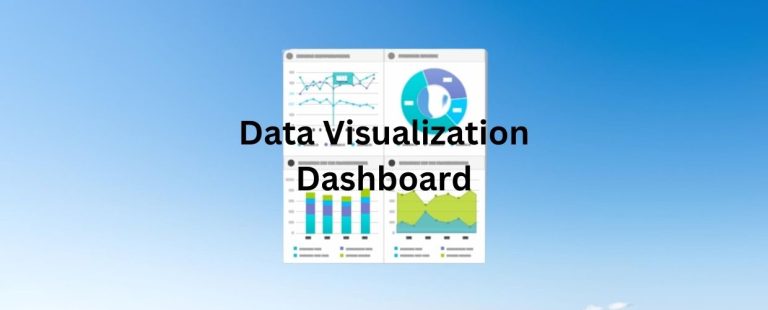
Effective data visualization is paramount to gaining actionable insights and communicating information in data-driven decision-making. In this article, we will delve into the world of Highcharts and explore how it has revolutionized data visualization.
What is Highcharts?
Highcharts is an open-source JavaScript charting library that allows users to create interactive and visually engaging charts effortlessly. Developed by Highsoft AS, the platform has gained popularity for its seamless integration, robust performance, and comprehensive customization options. The library supports various chart types, including line charts, area charts, bar charts, pie charts, scatter plots, heat maps, and more.
Highcharts is a powerful and versatile charting library that has emerged as a leading solution for creating interactive and dynamic charts, graphs, and maps. With its intuitive interface, extensive chart types, and cross-platform compatibility, the visualization platform empowers developers, businesses, and data analysts to visualize complex data in a visually appealing and user-friendly manner. Its cross-platform compatibility makes it suitable for web applications, mobile devices, and desktops, providing a consistent user experience across devices.
Recommendations and Ratings
EXPERT RECOMMENDATIONS
Overall
-
Easy-of-Use - 80
-
Feature and Functionality - 85
-
Customer Support - 85
-
Setup and Integration - 85
-
Value of Money - 85
User Review
4 (1 vote)Key Features and Capabilities of Highcharts
Highcharts offers comprehensive features and capabilities that make it a popular choice for data visualization. Let’s explore some key components of this powerful charting library.
Chart Types and Customization
The platform supports various chart types, making them suitable for diverse data visualization needs. Users can customize charts with multiple styling options, including colors, labels, tooltips, and animations. The library’s flexibility allows developers to create visually stunning charts that align with their branding and design guidelines.
Interactive User Experience
Highcharts’ interactive features enhance user engagement and exploration. Users can zoom, pan, and hover over data points to access additional information. The library also supports drill-down functionality, enabling users to view data at different levels of granularity, making complex data more accessible and understandable.
Real-Time Data Visualization
The data visualization solution excels in rendering real-time data, making it ideal for applications that require dynamic and continuously updating visualizations. From live financial data to real-time analytics, Highcharts enables users to monitor data changes as they happen, facilitating prompt decision-making.
Exporting and Printing
Highcharts allow users to export charts as images or PDF files, making it easy to share and embed visualizations in various documents and presentations. Users can also print charts directly from the web application, ensuring data insights can be easily shared in physical formats.
Accessibility and Internationalization
The platform is committed to accessibility, making charts usable and navigable by individuals with disabilities. The library adheres to accessibility standards, ensuring visualizations are compatible with screen readers and keyboard navigation. Highcharts also support internationalization, allowing users to display data labels and axis values in different languages and formats.
Cross-Browser Compatibility
Its compatibility with various web browsers, including Chrome, Firefox, Safari, and Internet Explorer, ensures that users can access visualizations seamlessly regardless of their preferred browser. The library is built to provide consistent performance and appearance across different environments.
Impact and Benefits of Highcharts
The adoption of Highcharts has profoundly impacted data visualization and decision-making processes. Let’s explore some key benefits of using the platform.
Enhanced Data Understanding
Its visualizations enable users to comprehend complex data quickly and effortlessly. With interactive features like tooltips and drill-downs, users can explore data points in detail, leading to deeper insights and a better understanding of trends and patterns.
Data-Driven Decision-Making
Highcharts empowers businesses to make data-driven decisions by presenting data visually compellingly. Clear and interactive visualizations help decision-makers identify opportunities, detect issues, and communicate strategies effectively.
Improved User Engagement
The platform’s interactive and visually appealing charts enhance user engagement, keeping audiences interested and invested in the presented data. Engaging visualizations increase user retention and drive participation in data exploration and analysis.
Faster Insights and Analysis
By creating dynamic charts with Highcharts, data analysts and developers can rapidly transform raw data into actionable insights. The library’s user-friendly interface and comprehensive customization options accelerate the chart creation process, saving valuable time and resources.
Seamless Integration with Web Applications
Its compatibility with modern web technologies and frameworks makes integrating charts into existing web applications accessible. Developers can effortlessly embed Highcharts visualizations into web pages, dashboards, and reports, enriching user experiences with data-driven visuals.
Flexibility and Scalability
Highcharts’ scalability allows it to handle large datasets and complex visualizations without sacrificing performance. Organizations can use the platform to create sophisticated dashboards and analytical tools that cater to growing data needs and evolving business requirements.
Conclusion
Highcharts has revolutionized data visualization, empowering businesses and analysts to create compelling, interactive charts that communicate complex information quickly. The library’s extensive chart types, customization options, and cross-platform compatibility have made it a preferred choice for developers and organizations seeking to enhance data-driven decision-making. By leveraging the platform’s power, businesses can unlock the potential of their data, transform it into actionable insights, and gain a competitive edge in today’s data-centric landscape. As data visualization plays a vital role in strategic decision-making, Highcharts stands at the forefront, enabling organizations to tell their data stories visually and drive innovation for a brighter future.


