Organizations face the constant challenge of turning vast amounts of data into meaningful insights in today’s data-driven world. This article will explore how FusionCharts has become a game-changer in data visualization and how it transforms data into captivating visual stories.
What is FusionCharts?
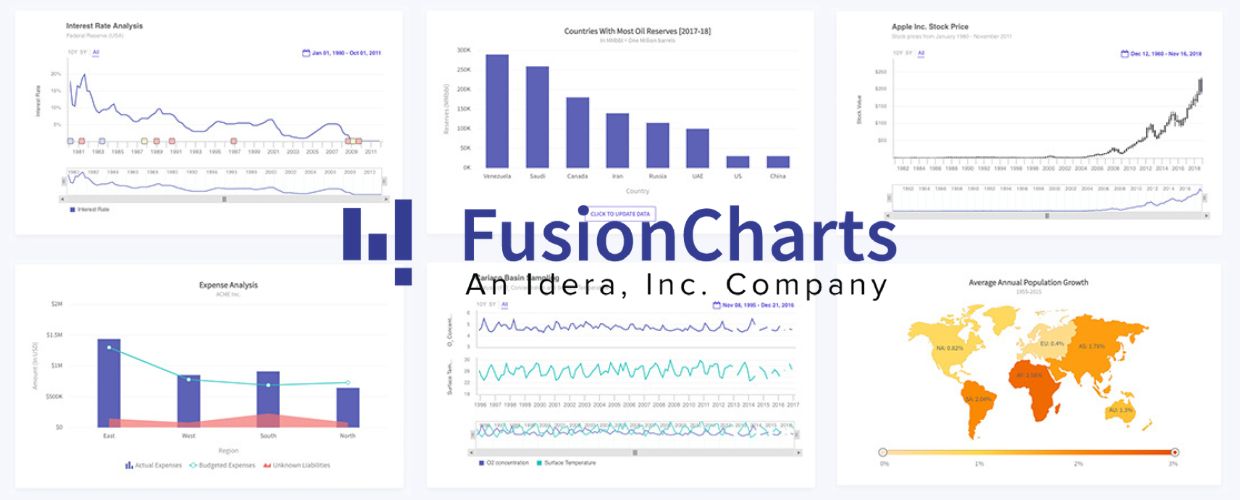
FusionCharts is a comprehensive JavaScript charting library offering an extensive data visualization component suite for web and mobile applications. Since its inception, the platform has been a trusted choice for businesses worldwide, from startups to Fortune 500 companies, due to its ease of use, flexibility, and powerful capabilities. The library provides a wide range of interactive charts, including line charts, bar charts, pie charts, area charts, scatter plots, and more, along with specialized charts like Gantt charts and treemaps.
FusionCharts is a leading data visualization and charting library that has been instrumental in helping businesses create captivating visual stories from their data. With its extensive collection of interactive charts, maps, and gauges, the platform empowers developers, analysts, and business users to communicate complex data visually and easily. Additionally, FusionCharts offers customizable map visualizations to create thematic maps and geographical data representations.
Recommendations and Ratings
EXPERT RECOMMENDATIONS
Overall
-
Easy-of-Use - 80
-
Feature and Functionality - 85
-
Customer Support - 85
-
Setup and Integration - 90
-
Value of Money - 85
User Review
4.4 (5 votes)Key Features and Capabilities of FusionCharts
FusionCharts offers many features and capabilities that make it a preferred data visualization solution. Let’s delve into some key components of this transformative library.
Diverse Chart Types
The platform boasts a vast collection of chart types, providing users with multiple options to visualize data. From basic line and bar charts for simple data representation to more advanced radar charts and heatmaps for complex data patterns, FusionCharts accommodates diverse data visualization needs.
Interactive and Dynamic
Its interactive charts enable users to interact with data points, drill down into details, and filter data, enhancing the user experience and encouraging data exploration. The charts are dynamic and responsive, adapting seamlessly to different screen sizes and devices, ensuring consistent data visualization across various platforms.
Real-Time Data Support
FusionCharts supports real-time data integration, making it ideal for applications that require instantaneous updates and dynamic data representation. The platform excels in rendering real-time data visualizations, whether monitoring stock prices, tracking website traffic, or visualizing sensor data.
Seamless Integration
It can be easily integrated into various web development frameworks, including Angular, React, Vue.js, and more. Its seamless integration capabilities simplify the charting process, enabling developers to quickly add visually stunning charts to their applications without extensive coding.
Customization and Theming
FusionCharts offers extensive customization options, allowing users to tailor charts to match their branding guidelines and design preferences. Users can easily modify chart colors, labels, fonts, and backgrounds, ensuring the visualizations align with the overall application aesthetics.
Comprehensive Documentation and Support
The platform provides comprehensive documentation and an active support community, making it easy for developers to get started and troubleshoot issues. The library is well-documented, with tutorials, examples, and guides to assist developers at every step of the data visualization process.
Impact and Benefits of FusionCharts
Adopting FusionCharts brings numerous transformative benefits for businesses seeking to elevate their data visualization capabilities. Let’s explore some key impacts of using the platform.
Enhanced Data Understanding
Data visualization is a powerful tool for simplifying complex datasets. FusionCharts empowers users to understand data patterns and relationships more intuitively. The interactive nature of the charts allows users to explore data points, identify trends, and uncover insights that might have otherwise gone unnoticed.
Improved Decision-Making
Data-driven decision-making is essential for businesses to stay competitive and agile. Its visually appealing charts enable stakeholders to grasp insights quickly, leading to informed decisions. Real-time data support ensures decision-makers work with the most up-to-date information, allowing for proactive responses to changing conditions.
Engaging User Experience
FusionCharts’ interactive and visually captivating charts enhance the user experience. Engaging data visualizations can retain user attention, increase data exploration, and create a lasting impact, improving overall user satisfaction and engagement with applications.
Simplified Data Communication
Businesses can simplify communicating complex data to technical and non-technical audiences with the platform. The visually appealing charts convey information, making it easier for stakeholders to understand and act on data insights.
Consistent and Scalable Visualization
FusionCharts ensures consistent and scalable data visualization across various devices and platforms. Whether accessed on desktops, tablets, or smartphones, the charts maintain responsiveness and interactivity, ensuring users have a seamless experience.
Time and Cost Efficiency
By providing a wide range of pre-built chart templates and customization options, FusionCharts accelerates the development process. Developers can quickly implement charts without extensive coding, saving time and reducing development costs.
Conclusion
FusionCharts has emerged as a versatile and powerful data visualization library, transforming raw data into captivating visual stories. With its extensive charting capabilities, real-time data support, and seamless integration options, the platform has become a go-to solution for businesses seeking to communicate data insights effectively. By empowering users to understand data patterns, make informed decisions, and engage with data meaningfully, the visualization solution stands at the forefront of modern data visualization solutions. As data drives business strategies and decision-making, FusionCharts paves the way for improved data understanding, better user experiences, and enhanced business outcomes in an increasingly data-centric world.
