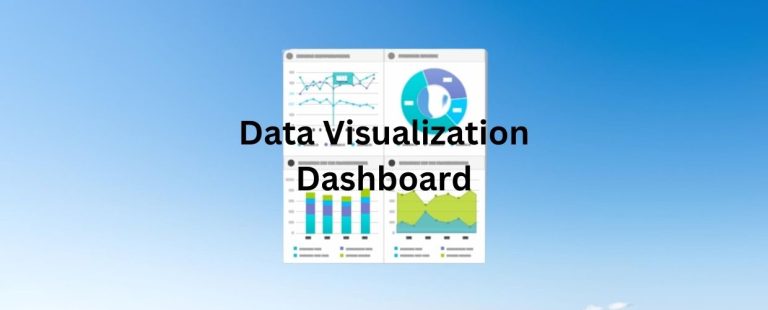
Data visualization is a powerful and transformative tool that turns raw data into meaningful and insightful visuals, helping individuals and organizations make informed decisions and gain a deeper understanding of complex information. In an increasingly data-driven world, the ability to present data visually has become essential in various fields, including business, science, healthcare, and academia. This article explores the significance of data visualization, its numerous benefits, the techniques employed, and its crucial role in empowering data-driven decision-making.
The Significance of Data Visualization
Data visualization is more than just creating aesthetically pleasing charts and graphs; it serves a crucial purpose in today’s data-rich environment. Its significance can be understood through the following key points:
Clarity and Comprehension
Visualizing data allows complex information to be presented in a simple and accessible manner. When data is presented visually, patterns, trends, and outliers become more apparent, making it easier for individuals to understand and interpret the data. This clarity enhances decision-making and problem-solving processes across different domains. Visualizations provide a clearer picture of the data’s implications, whether tracking financial performance or analyzing customer behavior.
Communication and Storytelling
One of the most compelling aspects of data visualization is its ability to tell a story. By creating compelling visual narratives, data visualization helps convey insights and findings to diverse audiences effectively. Whether presenting research findings, business performance metrics, or public health data, visualizations engage viewers and facilitate better communication. By translating data into compelling visuals, data storytelling becomes a powerful tool for engaging stakeholders and driving action.
Identifying Relationships and Patterns
Data visualization enables the identification of relationships and patterns that might otherwise go unnoticed in raw data. Scatter plots, heatmaps, and network diagrams are examples of visualization techniques that aid in recognizing correlations and connections between variables. By visualizing data points differently, analysts can gain deeper insights into the underlying relationships within the data.
Data Exploration and Analysis
Visualizations serve as a starting point for data exploration and analysis. By visually representing data sets, analysts can gain initial insights, identify data quality issues, and determine the need for further investigation. Interactive visualizations also empower users to drill down into specific data points and explore data from different perspectives, facilitating a deeper understanding of complex datasets.
The Benefits of Data Visualization
Data visualization is a powerful tool that can help us understand complex information and identify trends and patterns that might go unnoticed.
Improved Decision-Making
Data visualization empowers decision-makers to grasp complex information quickly and confidently and make data-driven decisions. Whether forecasting sales trends, analyzing market data, or evaluating project performance, visualizations provide a clear and concise view of the current scenario, enabling more informed choices.
Increased Efficiency and Productivity
Visualizing data streamlines the data analysis process, reducing the time spent deciphering raw data. Analysts can focus on interpreting insights and drawing actionable conclusions when information is presented in a visually digestible format, leading to increased efficiency and productivity. Automated visualization tools enhance efficiency by generating real-time visualizations, saving valuable resources.
Enhanced Data Sharing and Collaboration
Visualizations facilitate better collaboration among teams and stakeholders. Sharing visual representations of data enhances discussions and allows everyone to be on the same page, leading to more effective problem-solving and idea-sharing. Collaborating around visualizations improves collective understanding and fosters creativity and innovation within organizations.
Effective Presentation of Findings
When presenting insights to non-technical audiences, data visualization proves invaluable. Instead of overwhelming them with spreadsheets and numbers, visualizations help convey complex ideas visually engagingly, making presentations more persuasive and compelling. Visualizations bridge the gap between technical experts and decision-makers, enabling effective communication and informed decision-making.
Popular Techniques in Data Visualization
One of the popular techniques in data visualization is the use of charts and graphs to represent data clearly and concisely.
Line Charts
Line charts are commonly used to display trends over time, making them ideal for visualizing time-series data. They help analyze stock market trends, temperature changes, and other data with continuous variables. Line charts provide a clear visual representation of how a variable changes over a specific period, aiding in identifying trends and seasonal patterns.
Bar Charts
Bar charts are simple and effective for comparing data across categories. They are often used in market research, comparing sales figures for different products, or displaying survey results. Each bar’s length represents the data’s magnitude, allowing for easy comparison between different categories.
Pie Charts
Pie charts represent parts of a whole, making them suitable for showcasing proportions and percentages. However, they are best used when comparing a small number of categories to avoid confusion. Pie charts offer a quick way to understand the distribution of data within a whole and are often used in budget allocation, market share analysis, and demographic breakdowns.
Scatter Plots
Scatter plots display individual data points on a two-dimensional plane, making them perfect for identifying relationships between variables. They are extensively used in statistical analysis and scientific research. Scatter plots help visualize the correlation between two variables and identify clusters or outliers, providing insights into potential cause-and-effect relationships.
Heatmaps
Heatmaps use color gradients to represent data density, allowing patterns and clusters to stand out. They are popular in geographic data analysis, gene expression studies, and website analytics. Heatmaps provide an intuitive way to visualize large datasets and identify high or low-activity areas, making them valuable for spatial analysis and pattern recognition.
Network Diagrams
Network diagrams visualize relationships between interconnected entities, such as social networks, computer networks, or organizational structures. They help in understanding connections and communication flow. Network diagrams use nodes and edges to represent entities and relationships, visually representing complex networks and facilitating network analysis.
The Role of Data Visualization in Data-Driven Decision-Making
Data visualization plays a crucial role in data-driven decision-making, allowing us to quickly and easily identify patterns, trends, and outliers in complex data sets.
Identifying Business Insights
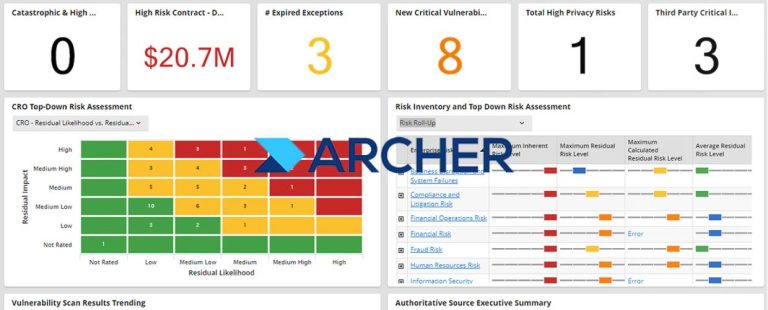
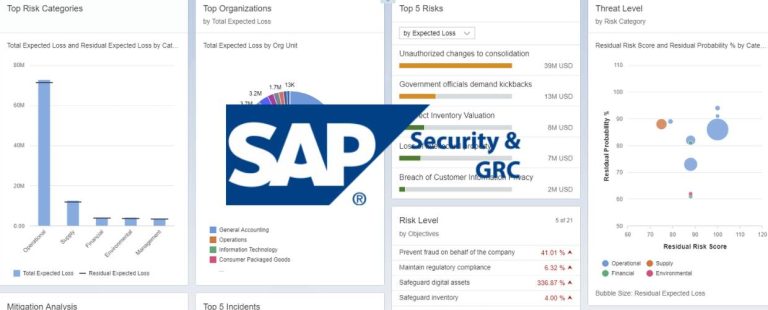
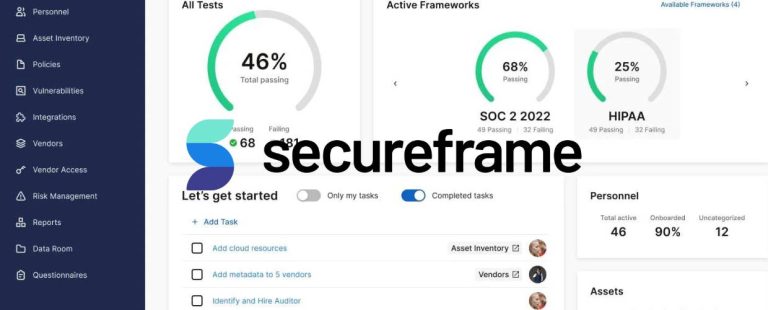
In business, data visualization is critical in identifying insights that drive growth and efficiency. From sales and marketing metrics to customer behavior analysis, visualizations assist businesses in making informed decisions to stay competitive. Interactive dashboards and visual analytics platforms allow companies to monitor key performance indicators (KPIs) in real time, enabling agile and data-driven decision-making.
Enhancing Scientific Research
In scientific research, data visualization aids researchers in understanding complex data sets and drawing meaningful conclusions. Whether in genetics, environmental studies, or climate research, visualizations help communicate findings effectively. Advanced data visualization techniques, such as 3D modeling and virtual reality, are transforming how researchers explore and analyze data, opening new avenues for scientific discovery.
Supporting Healthcare and Public Health
Data visualization has become vital in healthcare, especially during pandemics and disease outbreaks. Visualizations of infection rates, vaccination data, and hospital capacity aid policymakers and healthcare professionals in making informed decisions to protect public health. Real-time dashboards and interactive visualizations have been instrumental in tracking and responding to public health crises worldwide.
Conclusion
Data visualization is a transformative and indispensable tool that empowers individuals and organizations to make sense of the ever-increasing volume of data available today. Data visualization enhances decision-making processes across various domains by providing clarity, facilitating communication, and identifying patterns. It enables users to explore data, gain insights, and tell compelling stories that drive innovation, productivity, and progress.
As technology advances, data visualization will play an increasingly pivotal role in shaping our understanding of complex information and propelling us toward a data-driven future. Embracing the power of data visualization will be a fundamental step for organizations and individuals seeking to harness the full potential of their data and turn it into actionable knowledge.

